
Introduction
In today’s cybersecurity landscape, security by design is becoming a standard in software development. In this context, threat modeling plays a critical role in identifying, assessing, and mitigating potential security vulnerabilities in software systems as they are built. This report finds the majority of organizations that perform threat modeling do so from the the design stage of the software development life cycle, ‘shifting left’ to address security issues early. They are becoming executive priorities and Boards of Directors are requiring regular updates on their progress. The implementation of Threat Modeling is essential in over 70% of large (1$B+) and medium-sized ($200M to <$1B) enterprises in the UK and US . Notably, about a quarter of these companies apply threat modeling to three-quarters of their applications, along with secure coding guidelines as the predominant tool. Additionally, over half of the companies that implement threat modeling have a Security Champions program in place, which is generally found to be quite effective in fostering security awareness and practices.
Despite its integration and perceived importance, threat modeling faces significant challenges such as scalability and resource allocation, which impede its broader application. Training formats vary, with interactive hands-on and instructor-led training being the most popular, reflecting an emphasis on practical, application-specific learning. Although effective in reducing high-risk vulnerabilities and improving security team efficiency, keeping practices up-to-date and managing the costs associated with threat modeling are persistent hurdles. Investments continue to flow into training and technological solutions to improve security postures, reflecting the ongoing commitment to robust threat modeling practices.
Study Firmographics
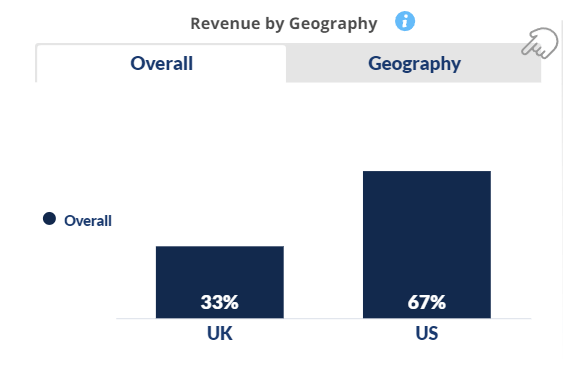
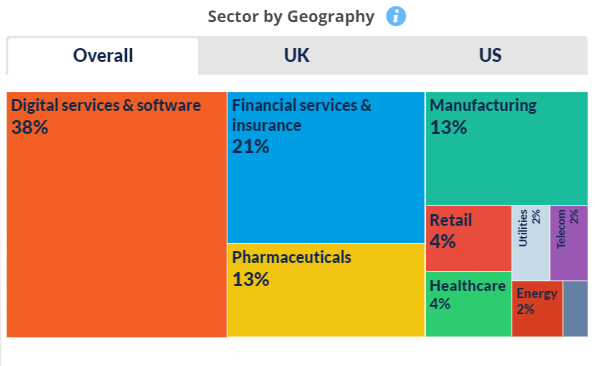
This study provides a comprehensive management view on companies in the UK and US that undertake Threat Modeling across a broad array of industries.
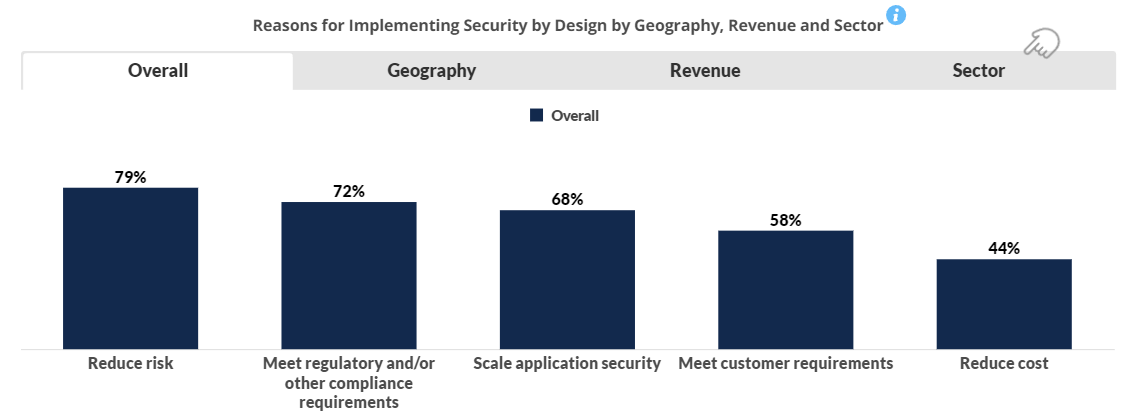
Implementing Security by Design
Reducing risk is #1 followed by the need to meet regulatory and compliance standards. These findings hold for both the US and the UK. Medium sized enterprises place virtually the same weight on compliance and risk. The pharmaceutical sector differs from others in prioritizing the need to scale application security while meeting both regulatory and customer requirements.
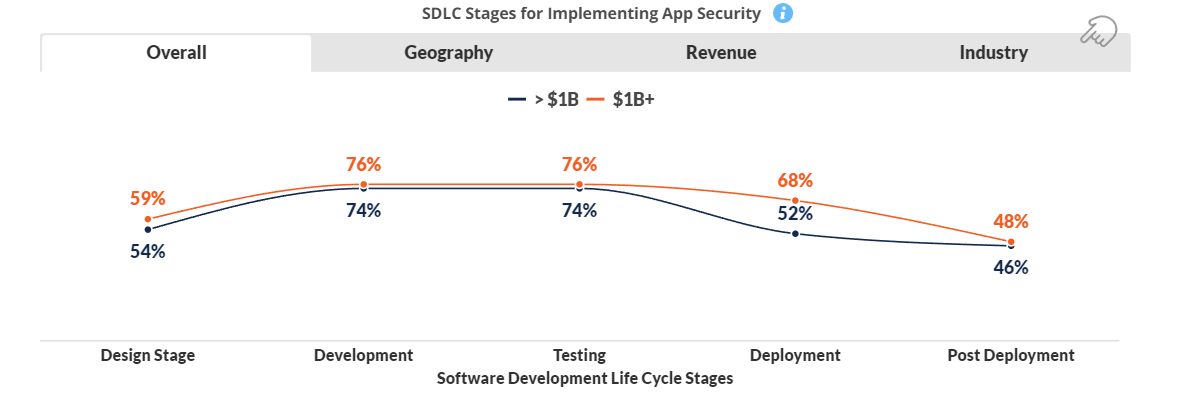
SDLC Stages for Implementing App Security
A noticeable “shift left” has occurred, with over half of companies conducting Threat Modeling at the Design Stage.
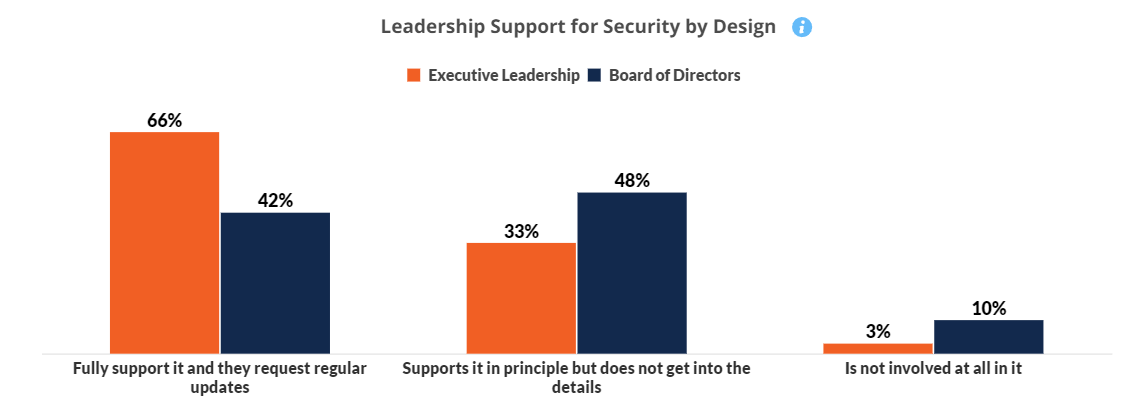
Leadership Support for Security by Design
Generally, senior leadership supports Security by Design including getting regular updates while Board of Directors mandate it but do not get into the details.
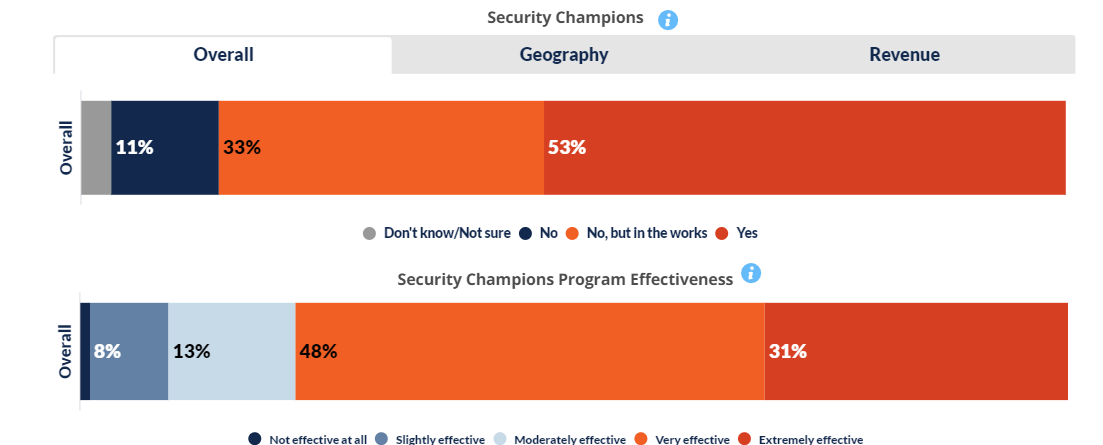
Security Champions
Over half of the companies who do Threat Modeling have a Security Champions program and of those who do, most find it quite effective.
Threat Modeling Approaches
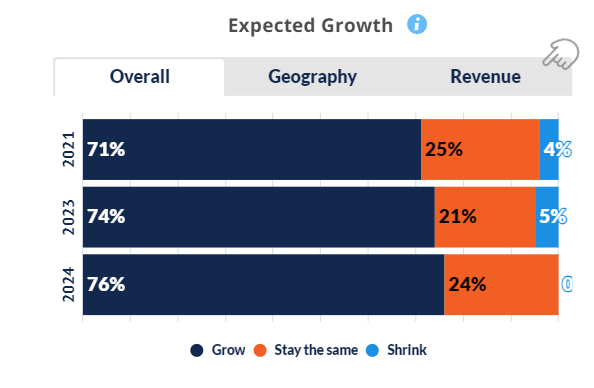
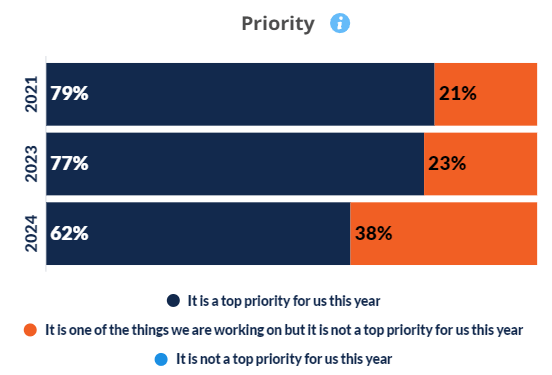
While Threat modeling is a key priority in 2024, for many companies it has become an integral part of software development. Hence, it continues to grow but has lessened as a separate “strategic priority”.
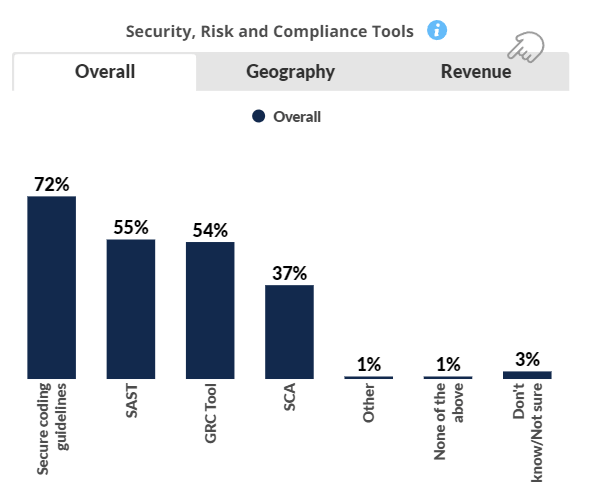
Frequency and Tools Used
A quarter of companies are conducting TM on 75% or more of their applications. Secure coding guidelines are by far the most commonly used TM tool in the US and UK, and for both medim and large companies.

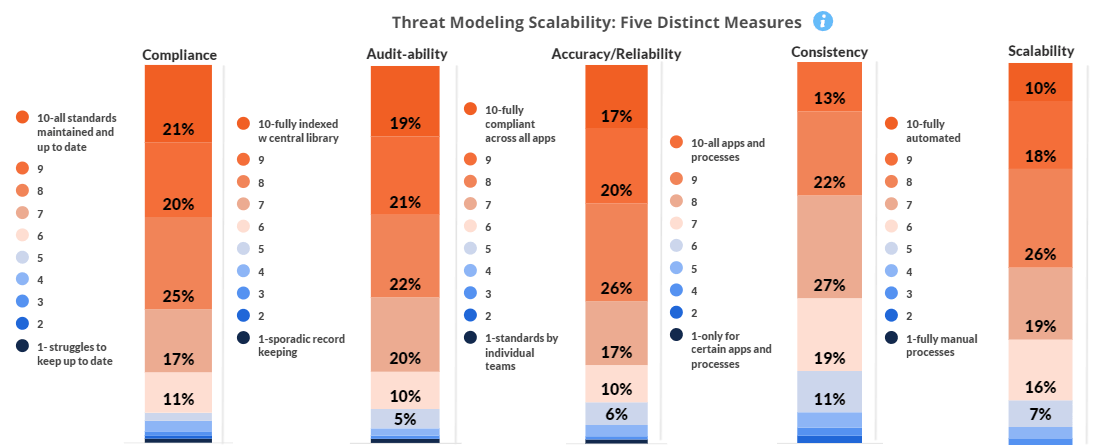
Scalability
All companies are making considerable efforts at scalable Threat Modeling processes, although the ability to fully automate the process is only claimed by one in ten companies doing TM
Challenges
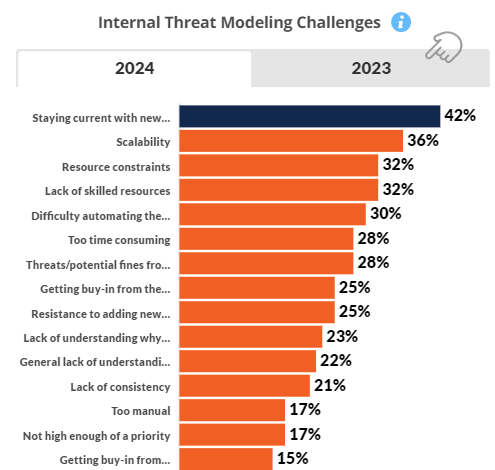
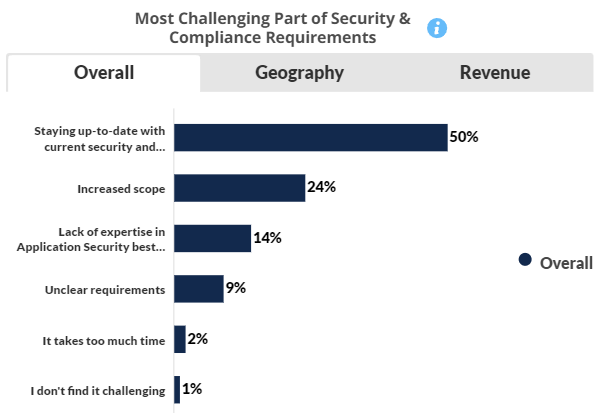
Staying current both on new threats and the related security compliance and regulations to manage them are by far the biggest external and internal cybersecurity challenges.
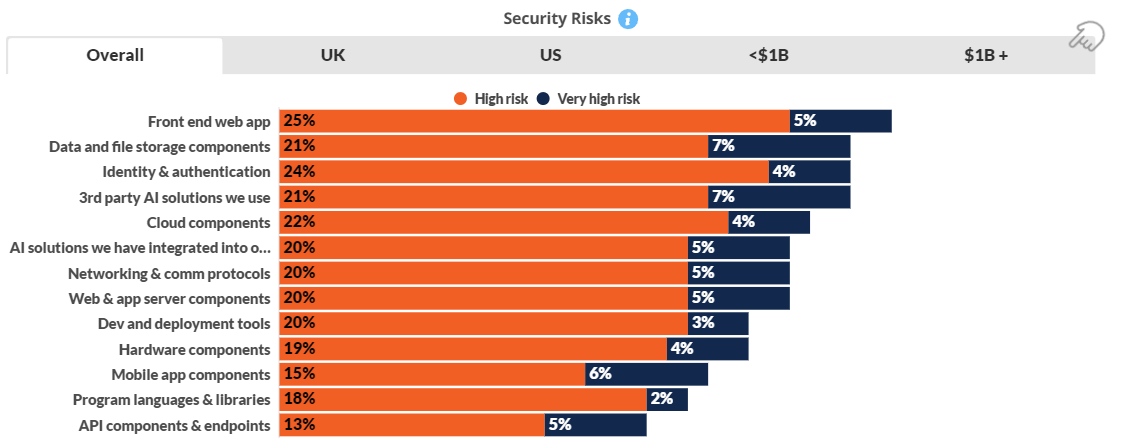
Security Risks
While front end web applications pose the greatest security risk overall, there is quite a bit of variation between the UK and the US, and between medium vs. large sized enterprises. Identity and authentication is the largest security risk in the UK, data and file storage components for large enterprises.
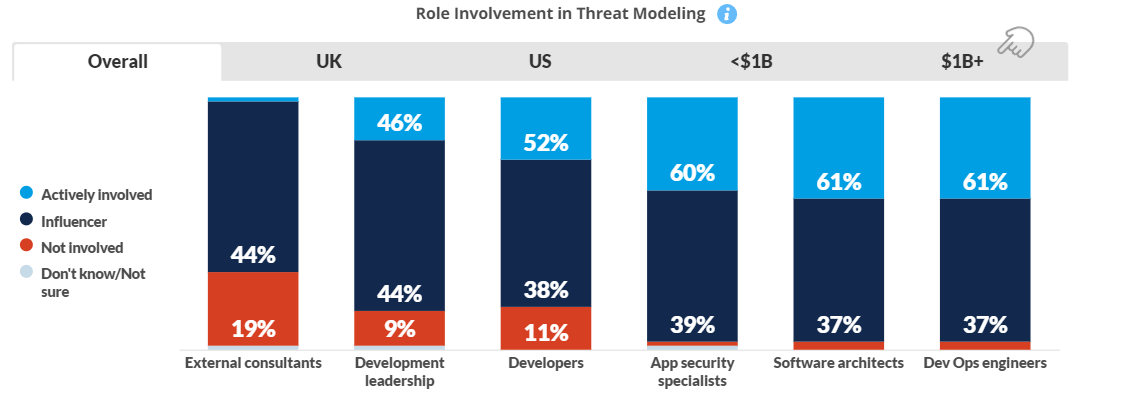
Role Involvement in Threat Modeling
Dev Ops engineers are typically most actively involved in Threat Modeling although this varies by geography, with more Developers actively involved in the UK than in the US.
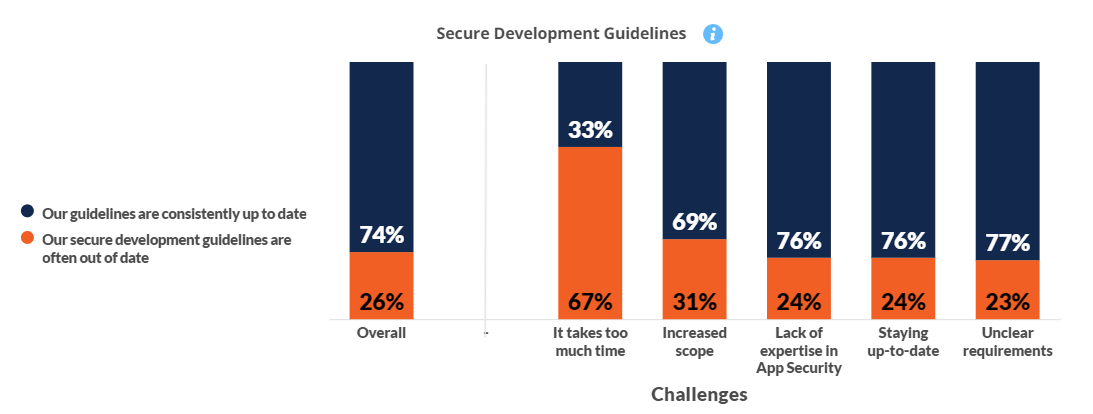
Challenges Versus Staying Up-to-date
While three quarters claim that their Guidelines are up to date, for those for who are not, the #1 reason is because “it takes too much time” to do so.
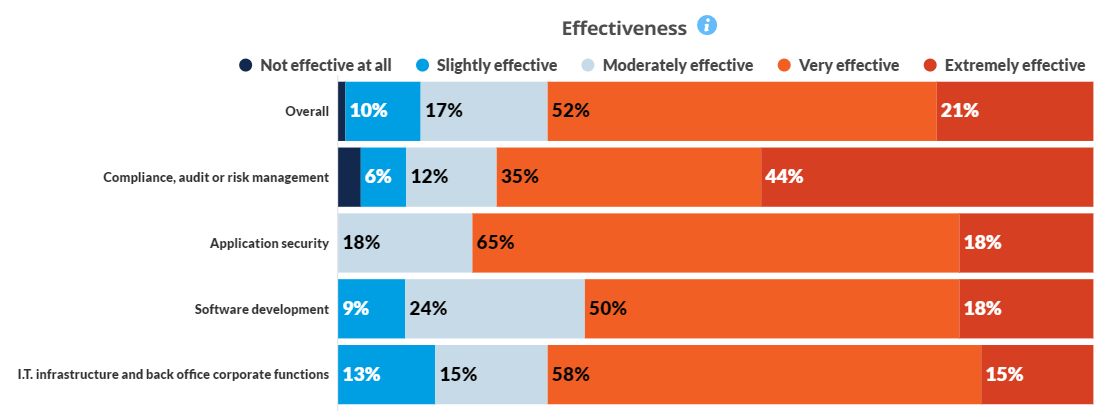
Effectiveness of Threat Modeling
Generally, threat modeling efforts are viewed at effective. However, there is variability on this view across roles. Application security has a very positive view and by contrast, IT Infrastructure a less favorable one.
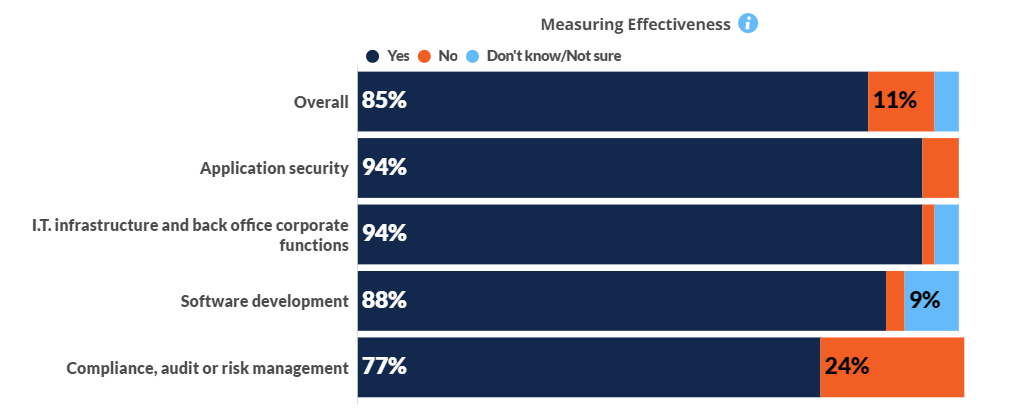
Measuring the Effectiveness of Threat Modeling
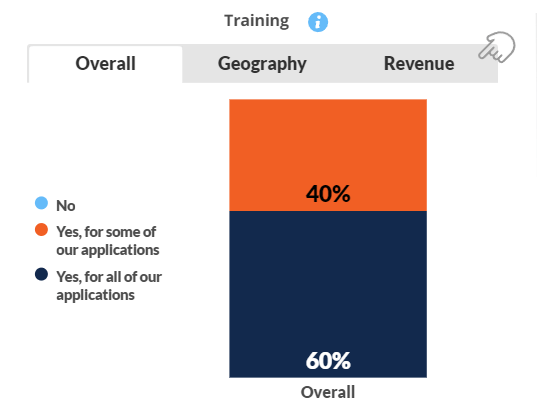
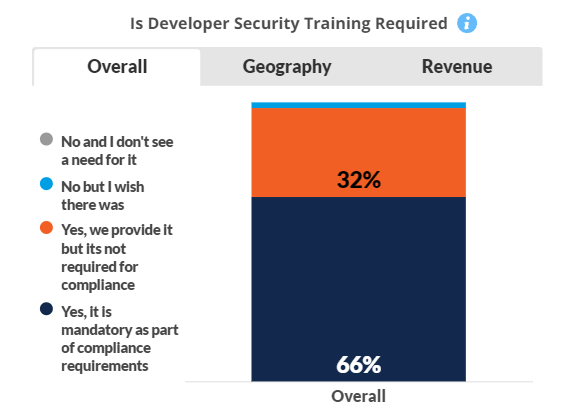
The majority of companies provide secure development training and of those who do, two thirds do so because it is mandatory for compliance. This finding was the same for the US and the UK. Large enterprises are more likely to provide it for all applications.
Training
The majority of companies provide secure development training and of those who do, two thirds do so because it is mandatory for compliance. This finding was the same for the US and the UK. Large enterprises are more likely to provide it for all applications.
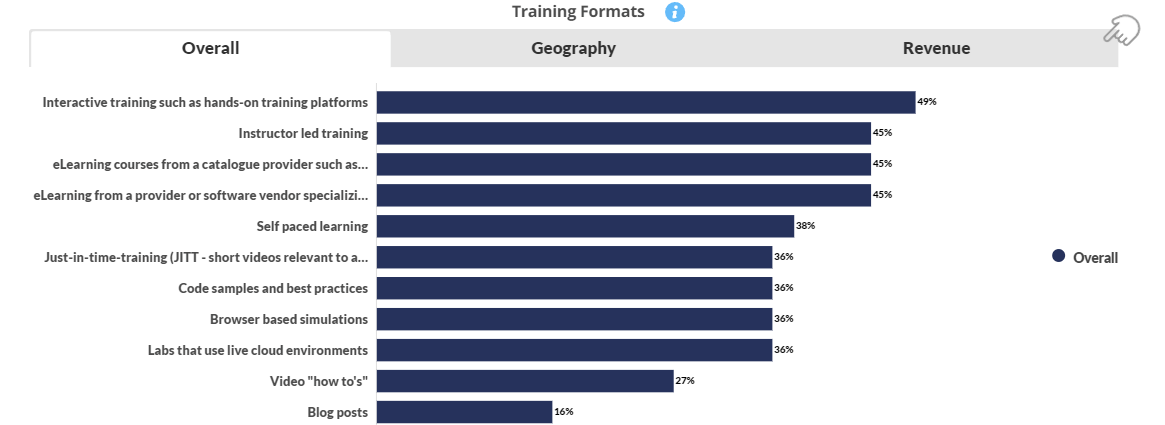
Security Training Formats
Interactive hands-on training formats are the most popular overall followed by instructor led training. Notable difference in formats were seen between the US and the UK, with the latter much more likely to use self paced learning and JITT.
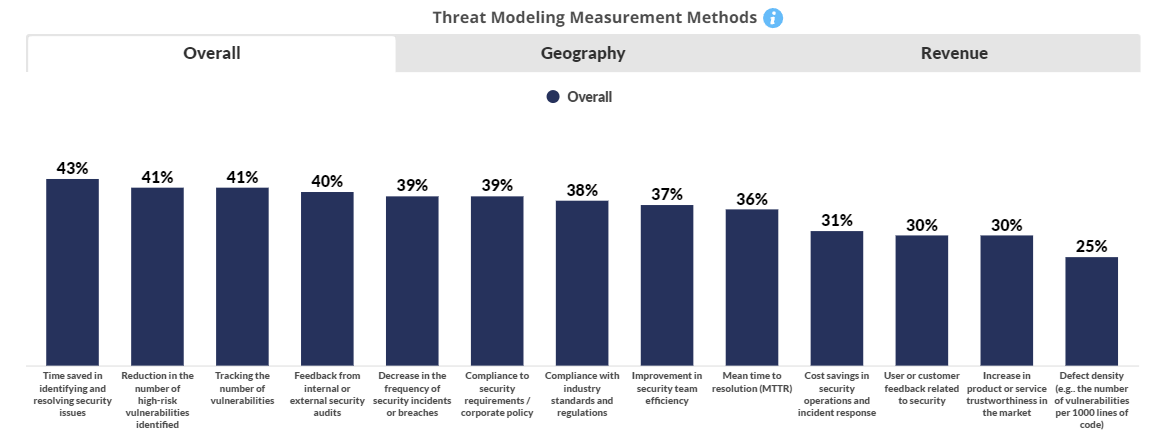
Measurement Methods
Time savings is the most prevalent method of measurement. In the UK, reduction in the number of high-risk vulnerabilities is a much more common measure than in the US. In terms of differences by revenue size, large vs. medium corporations are much more likely to emphasize team efficiency improvement.
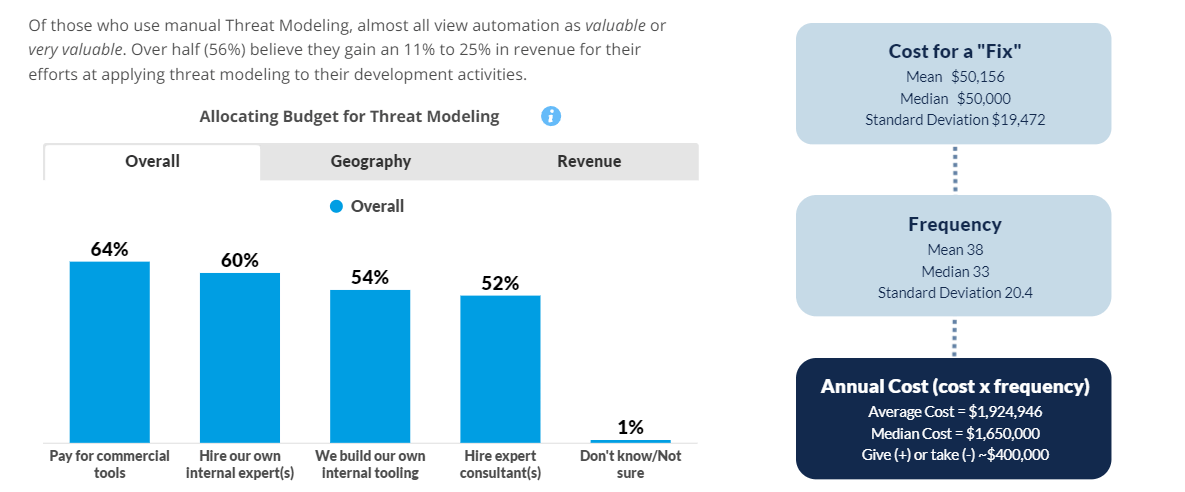
Allocating Budget for Threat Modeling
Conclusion
As we look to the future, it’s clear that security by design is increasingly a necessity for enterprises producing software, with threat modeling an integral component of this approach. The 2024 report has underscored its pivotal role in shaping a mature security posture, highlighting the evolution from traditional methods to advanced, automated practices that significantly enhance both operational efficiency and cybersecurity. Our findings emphasize the growing importance of comprehensive training programs and the effective deployment of Security Champions, which have proven essential in fostering a security-conscious culture.
Strategic budget allocations towards threat modeling are showing a substantial return on investment, enabling organizations to optimize their security practices without compromising speed or innovation. These investments are crucial as they support the development of sophisticated tools and training that drive the effectiveness of threat modeling practices.
As threat modeling becomes more embedded in the software development lifecycle, its strategic importance in safeguarding digital assets while fostering innovation is becoming self evident. Security Compass remains committed to advancing these practices, ensuring that organizations can navigate the complexities of modern cybersecurity with confidence and agility.