Static Version
Overview
What follows are highlights from four primary research studies Security Compass commissioned in 2021 on topics in Cybersecurity, covering DevSecOps, Cloud Adoption, Threat Modeling, and the US DoD. The research was conducted independently by Golfdale Consulting, Inc.
Balancing Security and Speed
In 2021, there was a rapid acceleration of Infrastructure as a Service (IaaS) cloud-based software development. Cloud development helped to address increased demand for faster, more scalable creation and deployment of software applications. However, accelerated software development came with an increasing number of hostile attacks.
Is it possible to improve time to market on new software builds while improving security from the start?
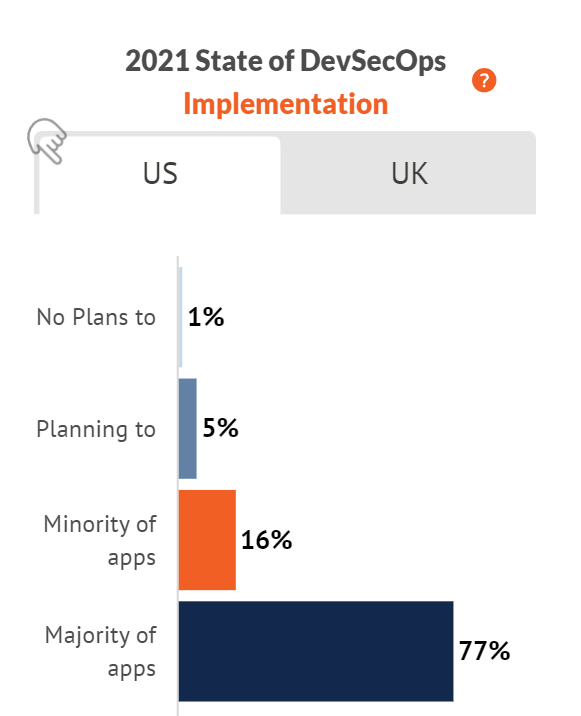
This becomes possible through a Balanced Development Automation (BDA) approach. Many companies are implementing DevSecOps, an approach that literally puts security as a center point integrated into software development and operations /deployment. With this approach, rapid development can be balanced with security in creating new software products.
Not surprisingly, the majority of large enterprises developing software in the US and the UK are taking this approach.
Overcoming Time to Market Issues
Even with these advances, technology executives and practitioners, along with their counterparts in risk and compliance, show a great deal of concern over time to market issues.
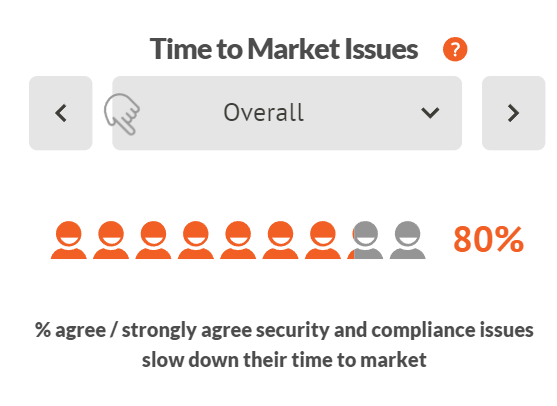
Surveying senior execs and practitioners quantified what we hear from many in the industry — 75% believe that manual processes for security and compliance hamper the ability to get new products to market.
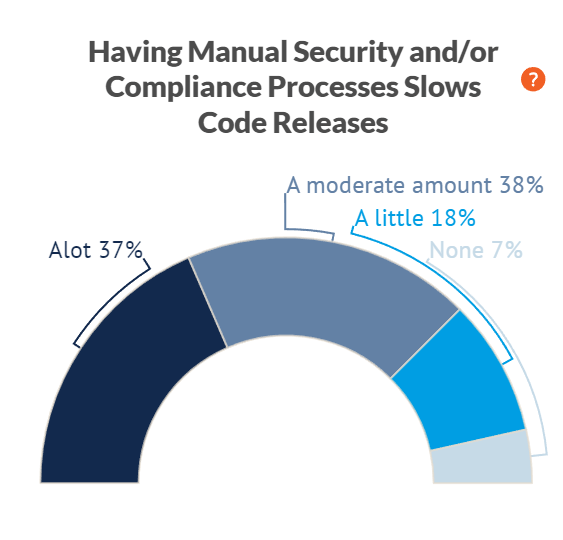
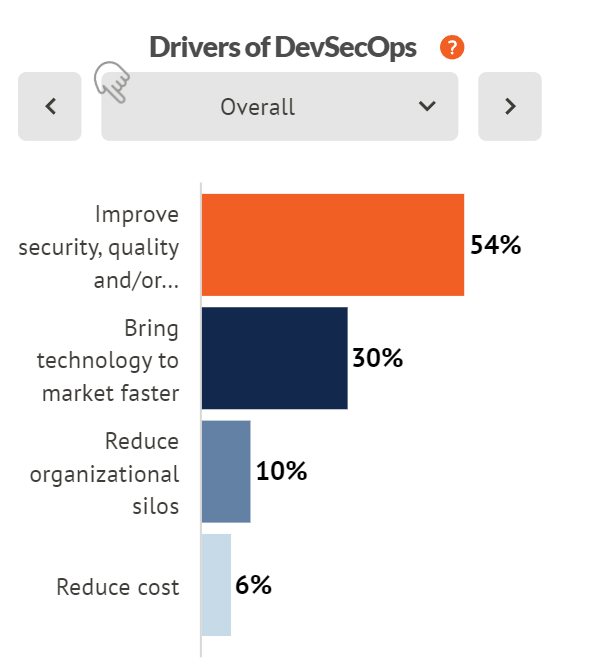
While speed to market is a great concern, it is clear that for the majority, balance is achieved by first ensuring there is improvement in security, quality and resilience.
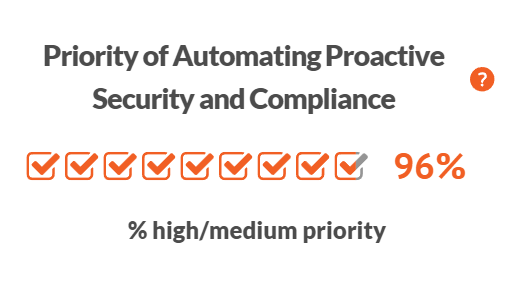
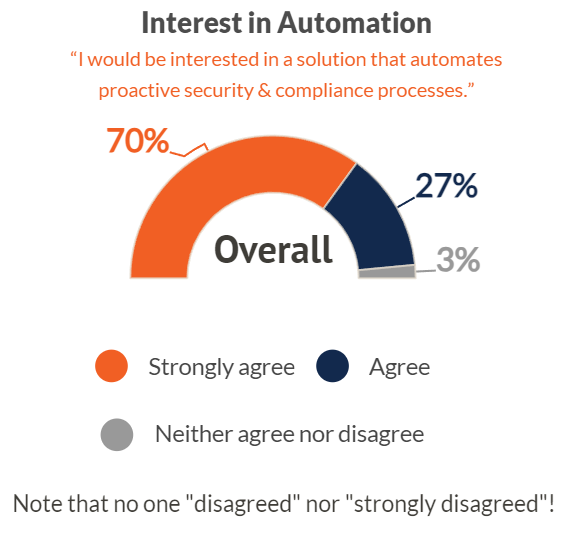
Heading into 2022, executives in companies producing software are in near unanimous agreement, automation of proactive security and compliance is of great importance.
Accelerated Cloud Development and Risk
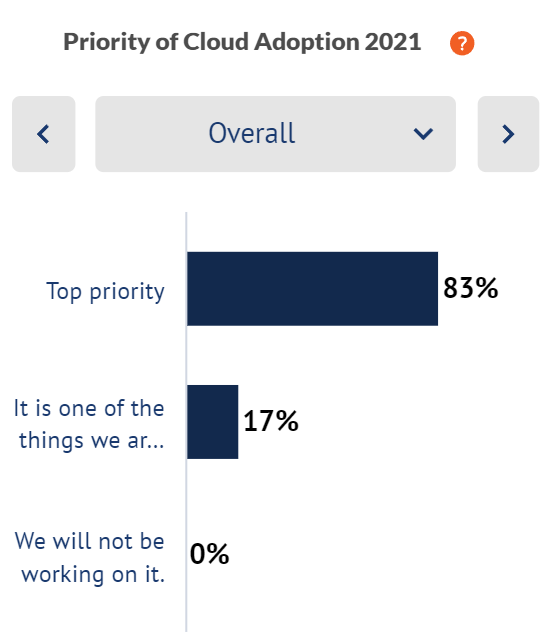
Cloud usage among enterprises continues its upward trends, outpacing fast-growth expectations of only just a few years ago. In 2018, a well-researched forecast was that by 2021, 35% of all enterprise workloads would be in public cloud applications; today, it globally stands at 50%, with expectations of an additional 7 percentage point gain in the next year. Security concerns have been a major impetus for this growth, with increasing needs for organizations to adjust their security posture to both keep attackers out (cybersecurity) and to minimize the damage caused once they are in (cyber resilience).
Our research among large enterprises that build cloud based applications confirmed these trends.
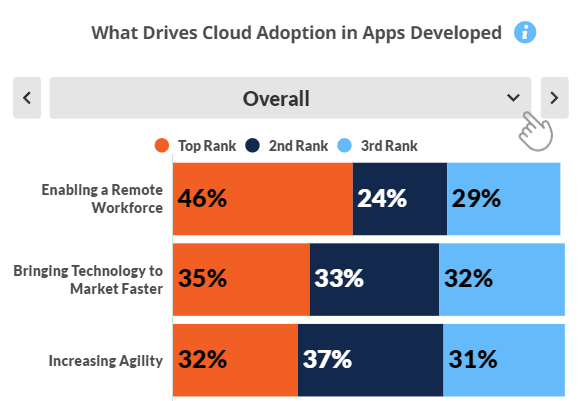
Driving this adoption has been the global push to enable remote work environments, especially among the largest ($5B+) companies.
Physician, heal thyself. Almost 100% of executives and practitioners alike believe automated security and compliance processes are core to the solution.
Proactive Security and Compliance
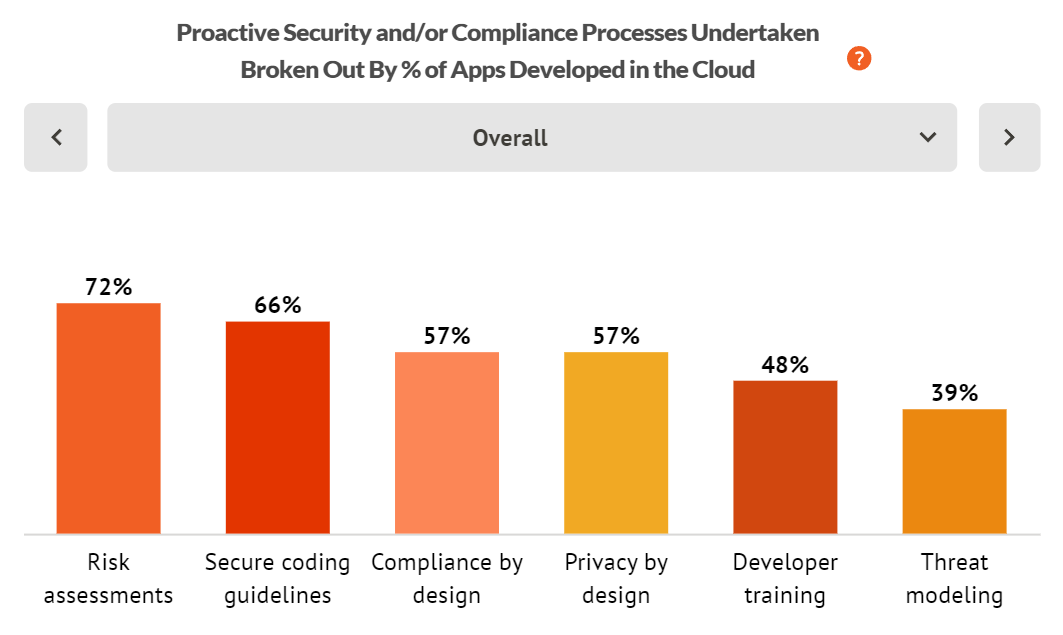
Among enterprises building cloud-based applications, proactive security and compliance processes are being undertaken. Most often, this approach is undertaken for risk assessments; least often for threat modeling. What is clear, the more apps that are developed in the Cloud, the greater the need for proactive security and compliance processes.
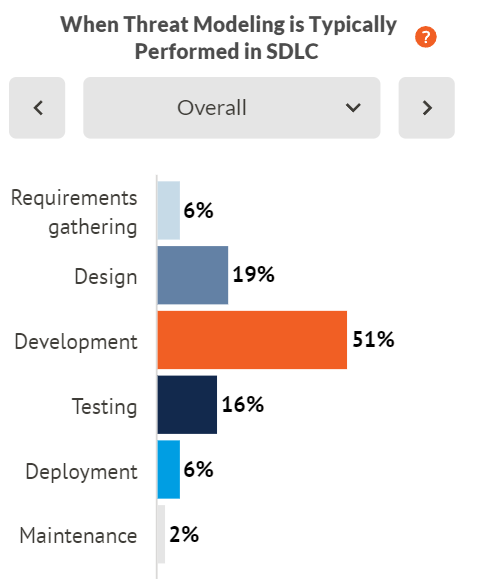
Threat Modeling = Greatest Opportunity
Despite less than half of enterprises undertaking threat modeling, we believe it is a core proactive cybersecurity practice that ensures applications can withstand future attacks. Among medium and large sized enterprises that do threat modeling, just over half in the US do so every release, a percentage that grows to three quarters in the UK.
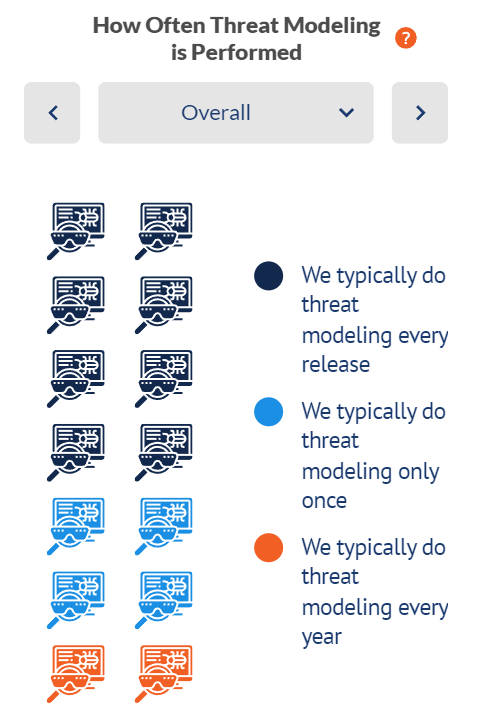
From the onset of the software development lifecycle, it is critically important to anticipate where attacks are likely to come from and to implement controls to mitigate risk from these threats.
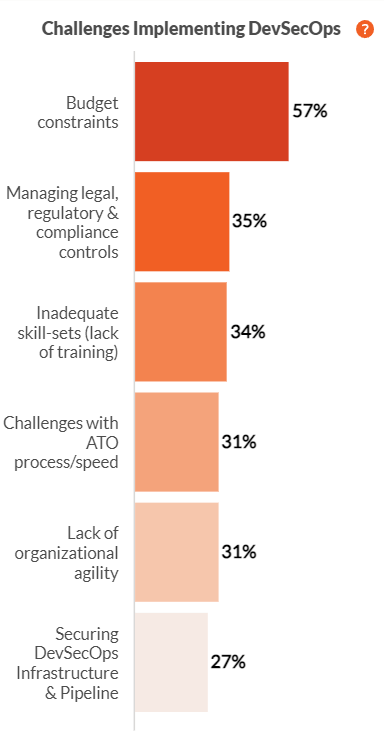
While more extensive threat modeling coverage is desired, internal challenges in doing so are numerous.
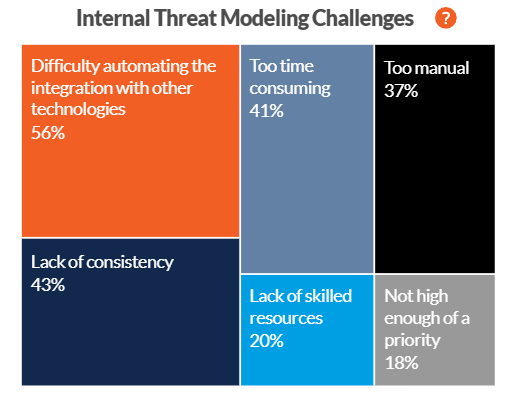
Across industries involved in software application development, the majority also do not start soon enough, during the requirements gathering and design stages.
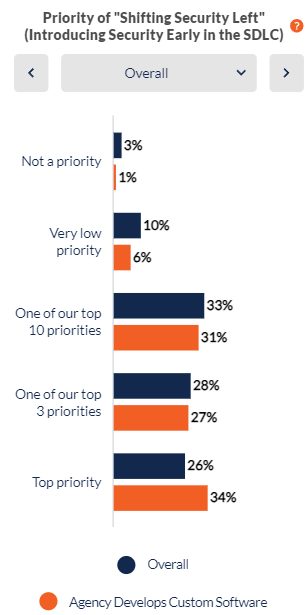
Increased threats to Government
Increasingly, governments are seeing the need to begin security sooner in the software development process. Termed “shift left”, this approach sits as one of the top priorities of US government agencies, particularly at the Federal level and especially among agencies that develop their own custom software.
The acceleration of cyber attacks in 2021, including governments and public utilities, has led to a need for an increased complexity of government defense. Indeed, in May of 2021 the US President signed an Executive Order on Improving the Nation’s Cybersecurity.
Challenges remain, however, in particular with obtaining adequate budgets to fully implement proactive security.