

Static Version
Introduction
In today’s cybersecurity landscape, threat modeling plays a critical role in identifying, assessing, and mitigating potential security vulnerabilities in software systems. This evidence-based research explores the current state of threat modeling and the challenges organizations face while scaling the process for applications they build and deploy.
Threat modeling involves various types of individuals, including developers, security analysts, and business stakeholders, working together to comprehend and address the security risks inherent in their applications. The views from these stakeholders are gathered, including the challenges they face.
This research explores the top technologies at risk, the time required to perform threat modeling, and how companies can build efficiencies into threat modeling to positively impact software releases by identifying and addressing vulnerabilities early in the development process. Emerging methodologies and tools that aid in scaling threat modeling across applications are explored.
In particular, this research explores the benefits of automation, how replacing manual processes can save time and reduce human error. Further, it quantifies how threat modeling can positively impact revenue by minimizing security incidents and protecting valuable assets.
As technology advances, so too must approaches to securing it against increasingly sophisticated threats. This research further advances the field by showcasing advances made over the past two years, in this follow up study on threat modeling that Security Compass first commissioned in 2021.
Current State
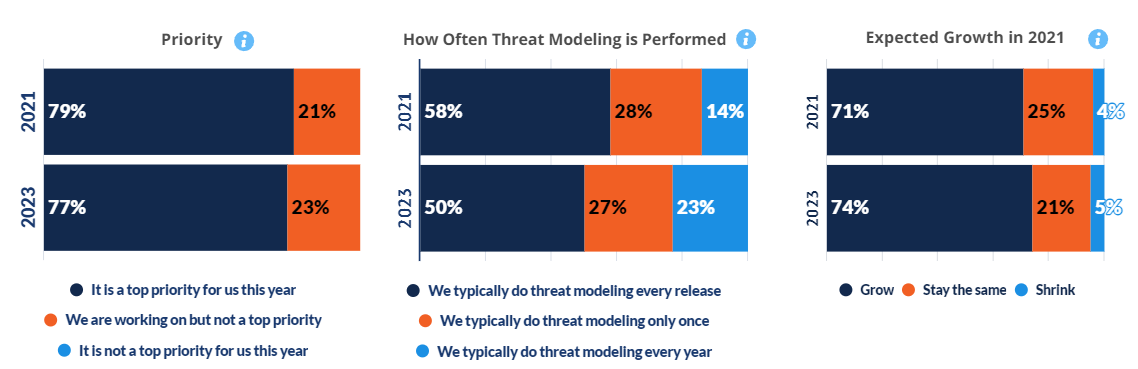
Threat modeling remains a key priority for most software development functions in large enterprises throughout the US, UK and Germany. While the percentage of companies performing it only once remains static, there has been movement with an increasing number of companies doing it annually versus every release.
People Involved in Threat Modeling
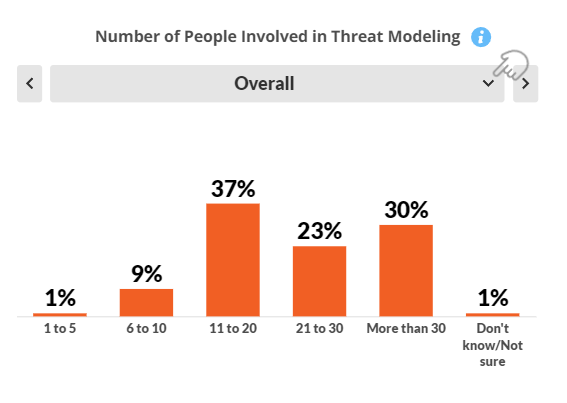
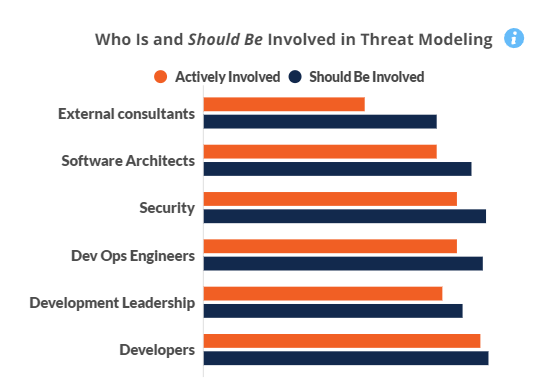
There is little consistency within or across sectors on how many are involved in performing threat modeling. It stands to reason that Developers are both involved and should be involved in threat modeling. Where significant gaps exist across all sectors are with external consultants and with software architects.
Technology Involved in Threat Modeling
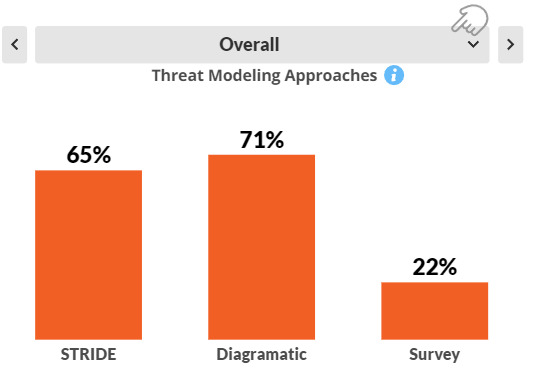
For companies under $1B in revenue, diagramatic approaches to threat modeling are most prevalent. With large enterprises over $1B, these are equal with STRIDE approaches.
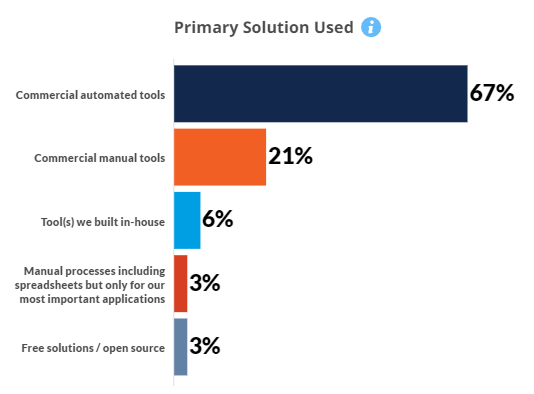
Commercial automated tools are now the primary solutions used across all medium to large enterprises, although this undoubtedly includes free software (e.g., MSFT Threat Modeling Tool).
Challenges
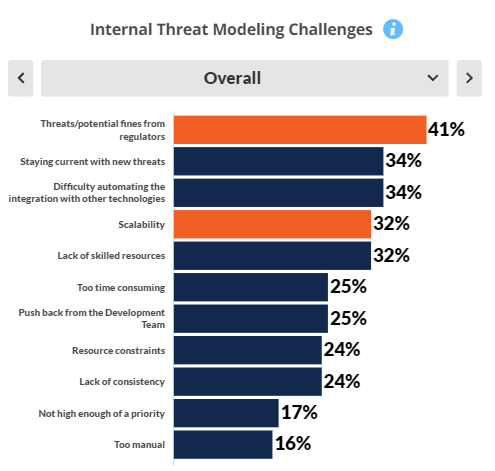
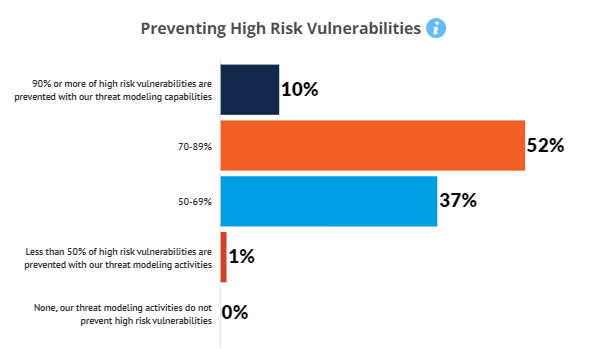
Potential fines from regulatory oversight are viewed as the most challenging internal threats, although for large enterprises this threat is matched with the challenge of scalability. Although a high percentage (70-89%) of risk vulnerabilities are addressed by threat modeling, most do not see it as covering all (90%+) high risk vulnerabilities.
New Technology Impact
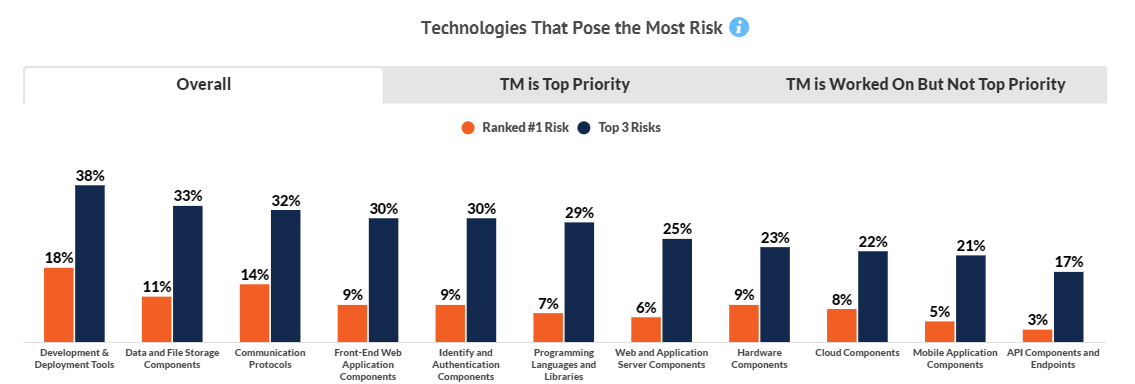
Overall, Development & Deployment Tools pose the largest security risks among companies where threat modeling is a top priority. For those in which threat modeling is worked on but not the top priority, Cloud Components are considered the greatest risk.
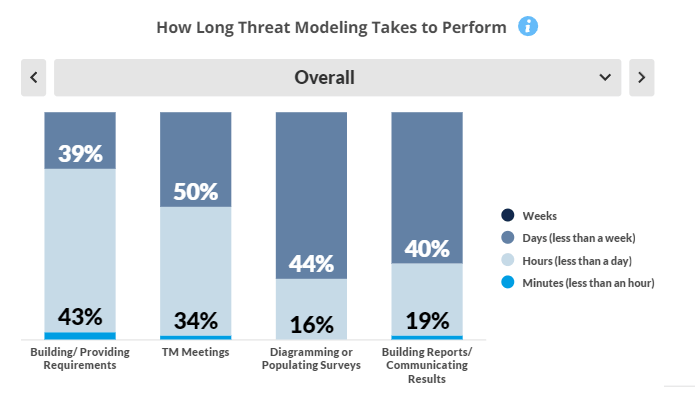
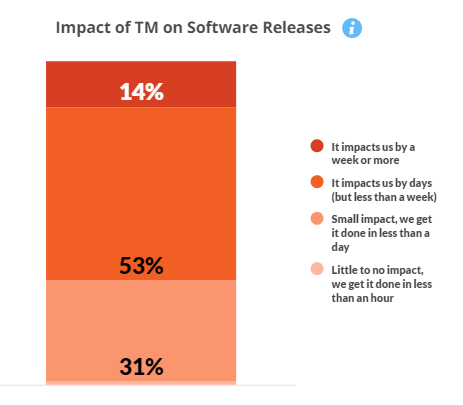
Time Taken to Perform Threat Modeling
Threat modeling is most time consuming during the diagramming/populating surveys stage, although communicating the results takes a close second. Just over half (53%) of companies find it imacts software releases by several days but less than a week’s time
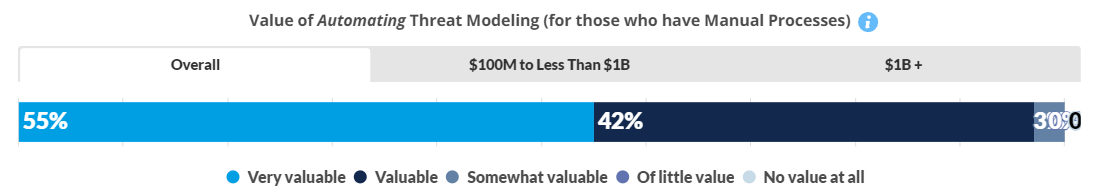
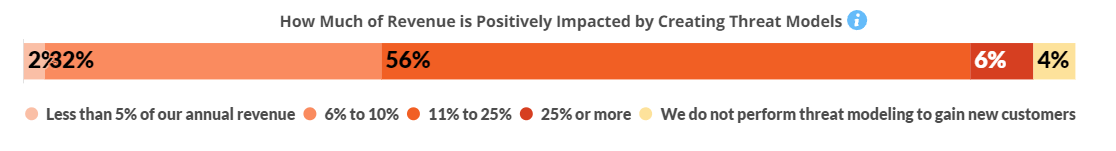
Value of Threat Modeling
Of those who use manual Threat Modeling, almost all view automation as valuable or very valuable. Over half (56%) believe they gain an 11% to 25% in revenue for their efforts at applying threat modeling to their development activities.
Conclusion
Threat modeling remains a top priority in software development in 2023, two years after our initial study on the topic, with slight growth expected again this next year. Across major sectors, some 90% of companies have at least 11 people directly involved in threat modeling, and a third have over 30. A view that more external consultants should be involved is widely held.
The largest challenge felt by individuals involved is the avoidance of regulatory penalties. Although most applications are covered by threat modeling, just 10% believe they cover 90% or more of their applications. Development & deployment tools are seen as most vulnerable/highest risk.
Commercial automated tools dominate although these undoubtedly include open source and free solutions. Diagramatic approaches are most frequently taken. These usually take several days to complete and a fair amount of time is then taken communicating the results. Overall, however, the impact on time is typically several days, not weeks.
Automation plays a key role in reducing this time, and likewise, in adding potential revenue by attracting new customers and business.