

Static Version
Developer-centric Cybersecurity
Relying on technical prowess to outwit cybersecurity threats is not enough; proactive approaches need to be taken by employees across the organization. These include not only the employees responsible for security but also system administrators, end users, and most critically, developers who build and maintain software.
To succeed, developers need to approach cybersecurity with proactive design, system thinking, technical alignment, a mature mindset that involves them in secure design, and automation to make cybersecurity manageable
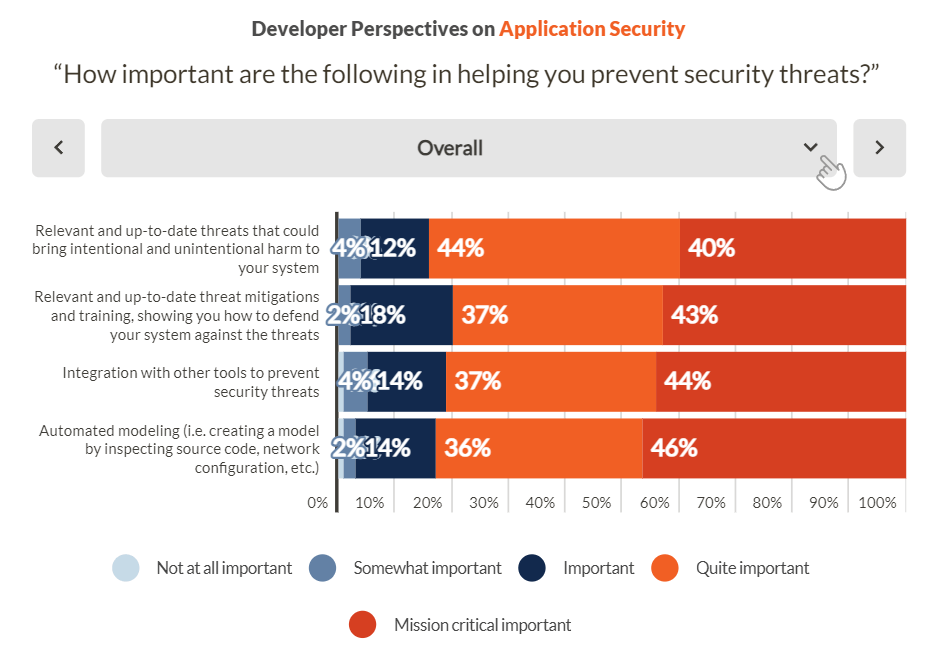
Automated threat modeling, integration with other tools, and matching the speed of new threats as they emerge are all highly important to developers from companies of all sizes.
Tools and Information Needs
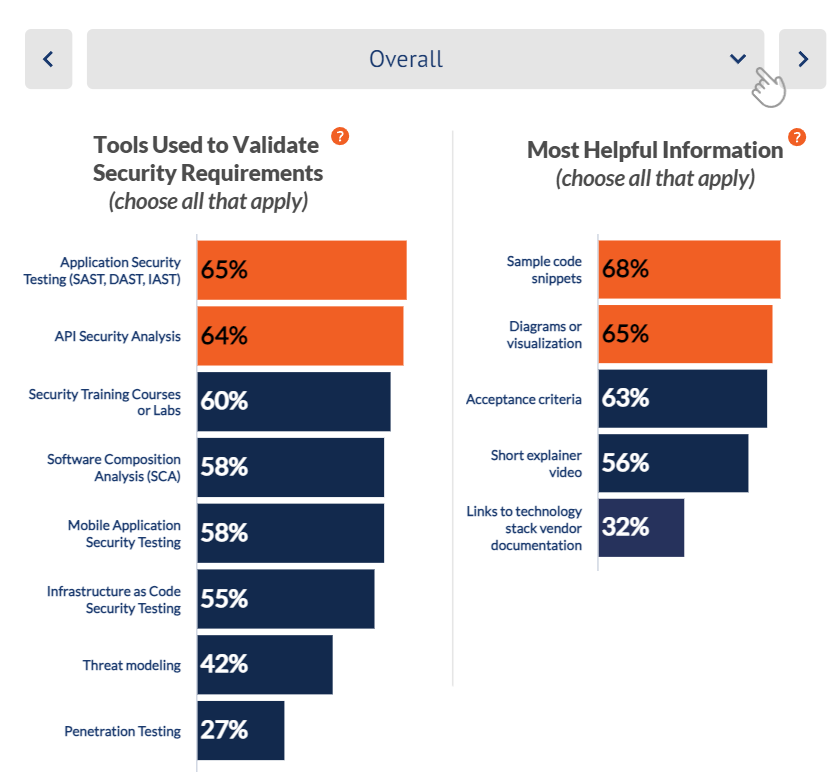
In terms of the tools used to validate security requirements, the top 3 are application security testing tools (SAST, DAST, IAST) followed by API security analysis and security training courses. ****
The most helpful information provided is typically sample code snippets followed by data flow diagrams.
SDLC and Security Requirements
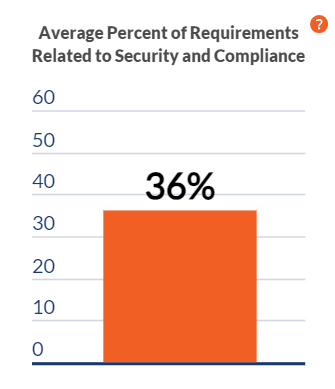
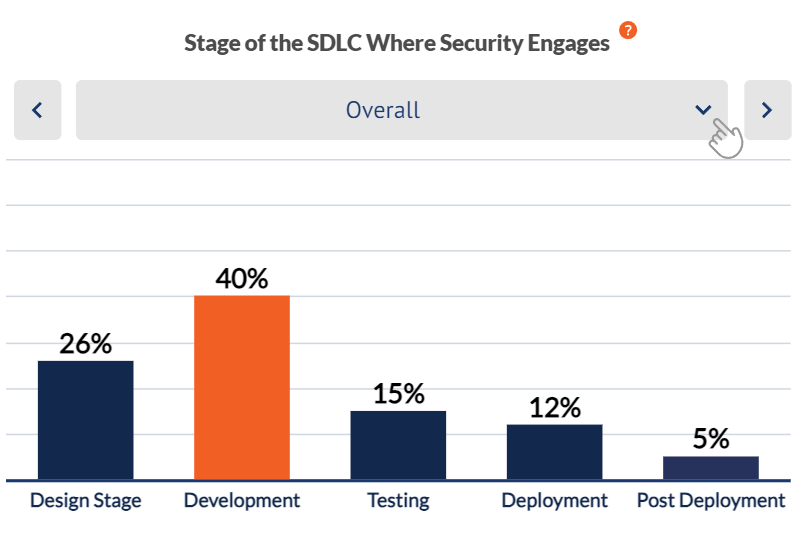
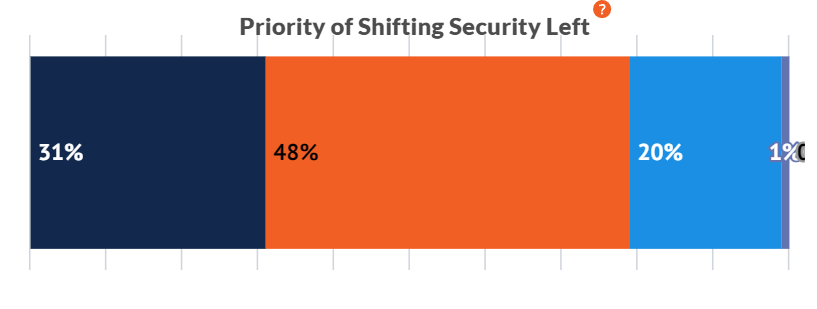
Developers surveyed reported a wide variation in the percent of their software requirements, user stories, and tickets in a typical release that were related to security and compliance. Surprisingly, on average a third of requirements were related to security and compliance. Only a quarter or so of companies have shifted security left into the Design stage of software development, a finding that held true irrespective of company size.
Overall, the Development stage dominates as to when security requirement are most likely to occur.
DevSecOps Perspectives on AppSec Training
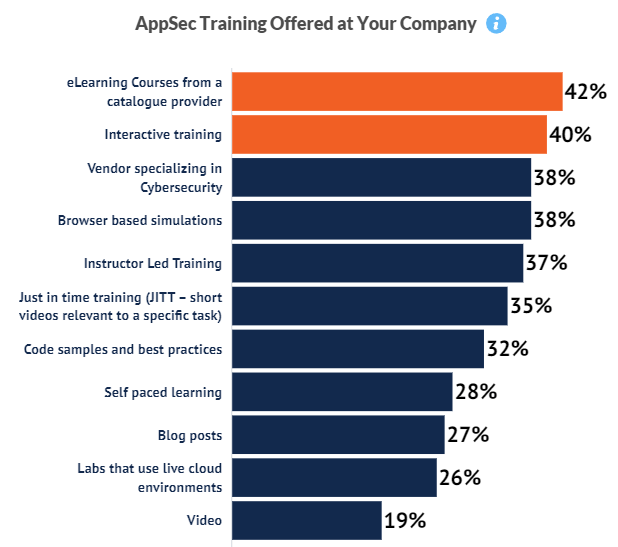
Virtually all companies offered their development, ops, and security teams some form of application security training, Of these, the most common forms of training are those from a catalogue provider and interactive training.
Training Timing
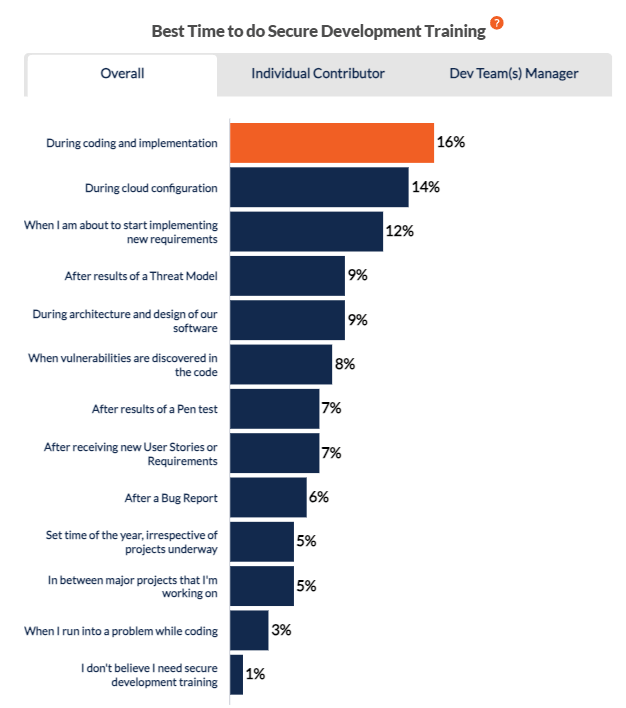
The best times for providing training for AppSec Security are during active design (requirements) and development / DevOps activity.
AppSec Training Challenges
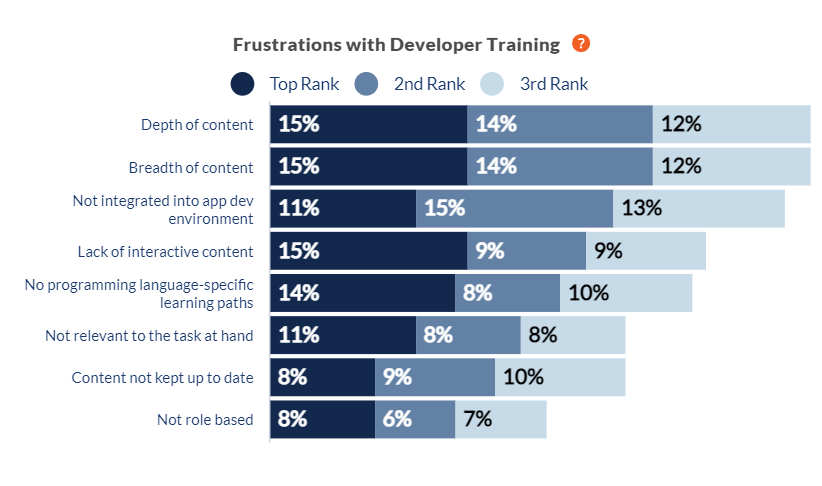
While frustrations vary widely, both the depth and breadth of content are most frequently cited.
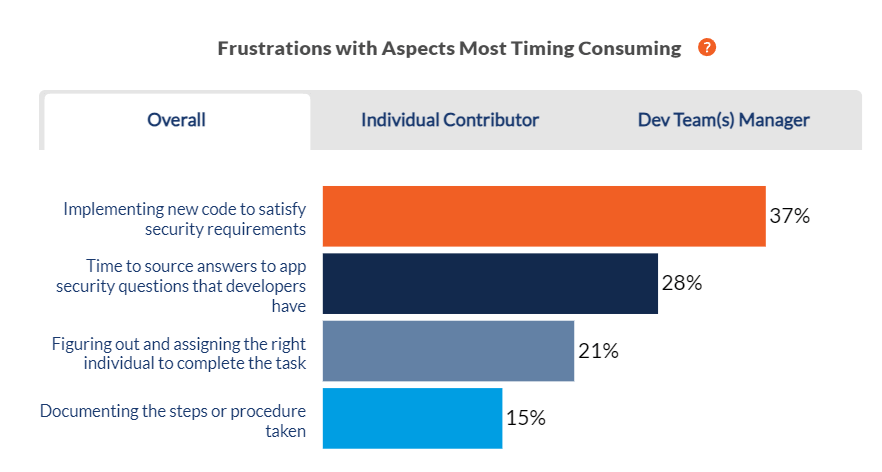
Implementing new code to satisfy security requirements is the most time consuming both for individual contributors and for development managers.
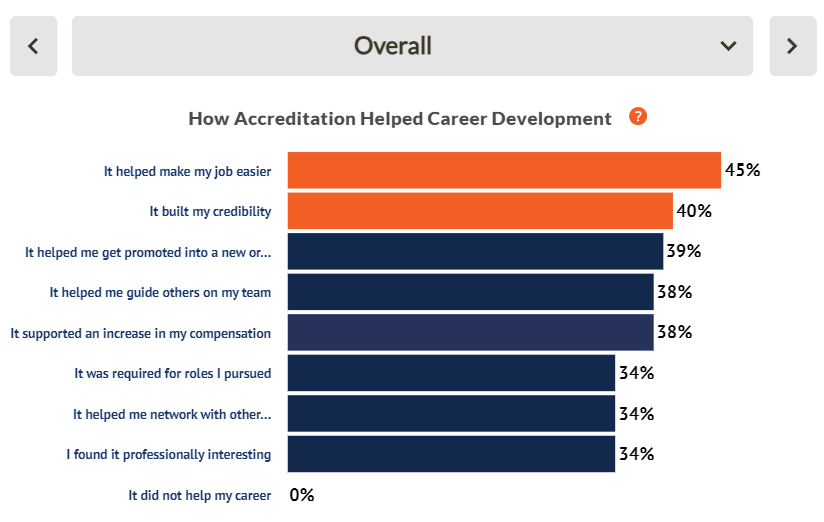
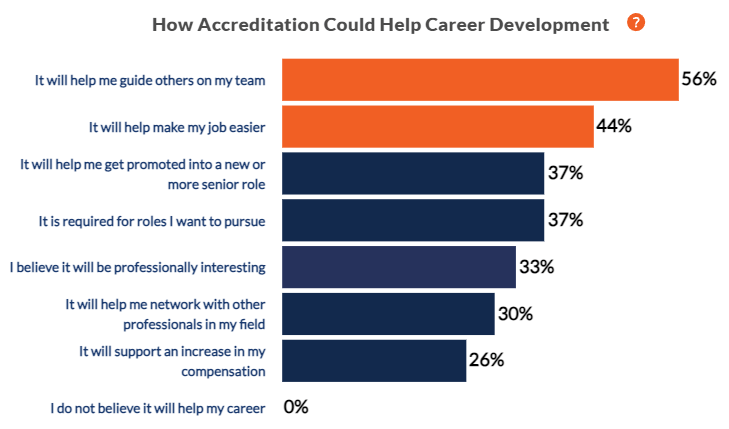
The Value of Accreditations
Security accreditation is broadly viewed as very helpful, for individual contributors, managers of development teams, and organizations. It helps individuals contribute and to guide others. Frustrations vary widely; both the depth and breadth of content are most frequently cited.
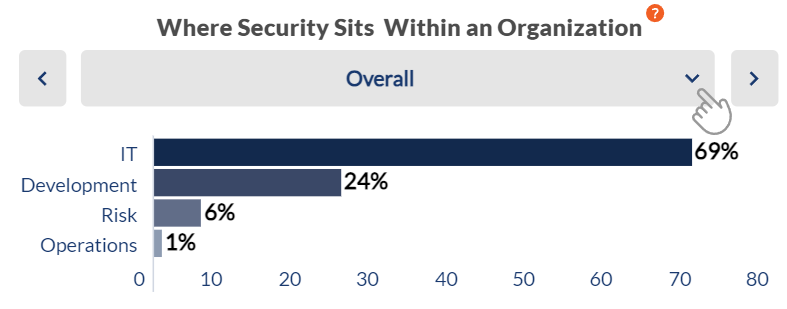
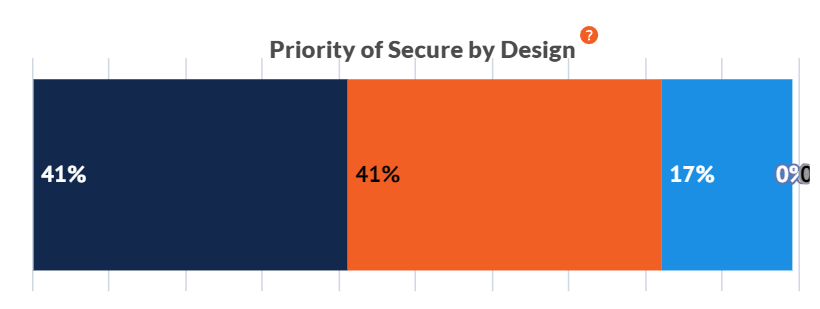
Application Security In the Mid-Market
For over two-thirds of mid-market companies that develop custom software, security sits within the IT department. Creating software that is secure by design and shifting security left are top priorities, especially for larger mid-sized companies.
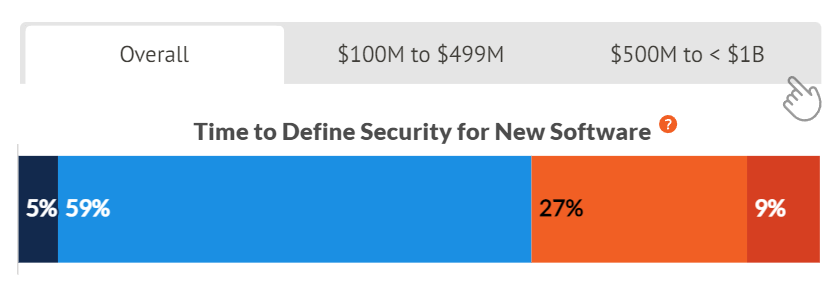
Defining Security Requirements
Very few companies are able to define security for new software nor are they able to track implemented controls in less than a day. The time spent is undoubtedly tied to manual processes in developing new software. Most (86% overall) believe that tracking inherited security from third parties would make the speed of delivering software faster or a great deal faster.
![]()